Pillar · Cost
Cloud cost management, in language your team can act on.
Spend, savings, commitments, and budgets, translated out of provider invoices and into views finance, engineering, and leadership can each use. Every saving has an owner and a number against it.
AWS · Azure · Read-only · No agents
Sound familiar?
Bills go up, nobody can explain why.
Rightsizing recs from AWS sit in a tab no one opens.
Reserved Instance and Savings Plan coverage is a quarterly panic.
Budgets exist in a spreadsheet that's already out of date.
"What did we actually save last month?" goes unanswered.
What you see · 1 of 3
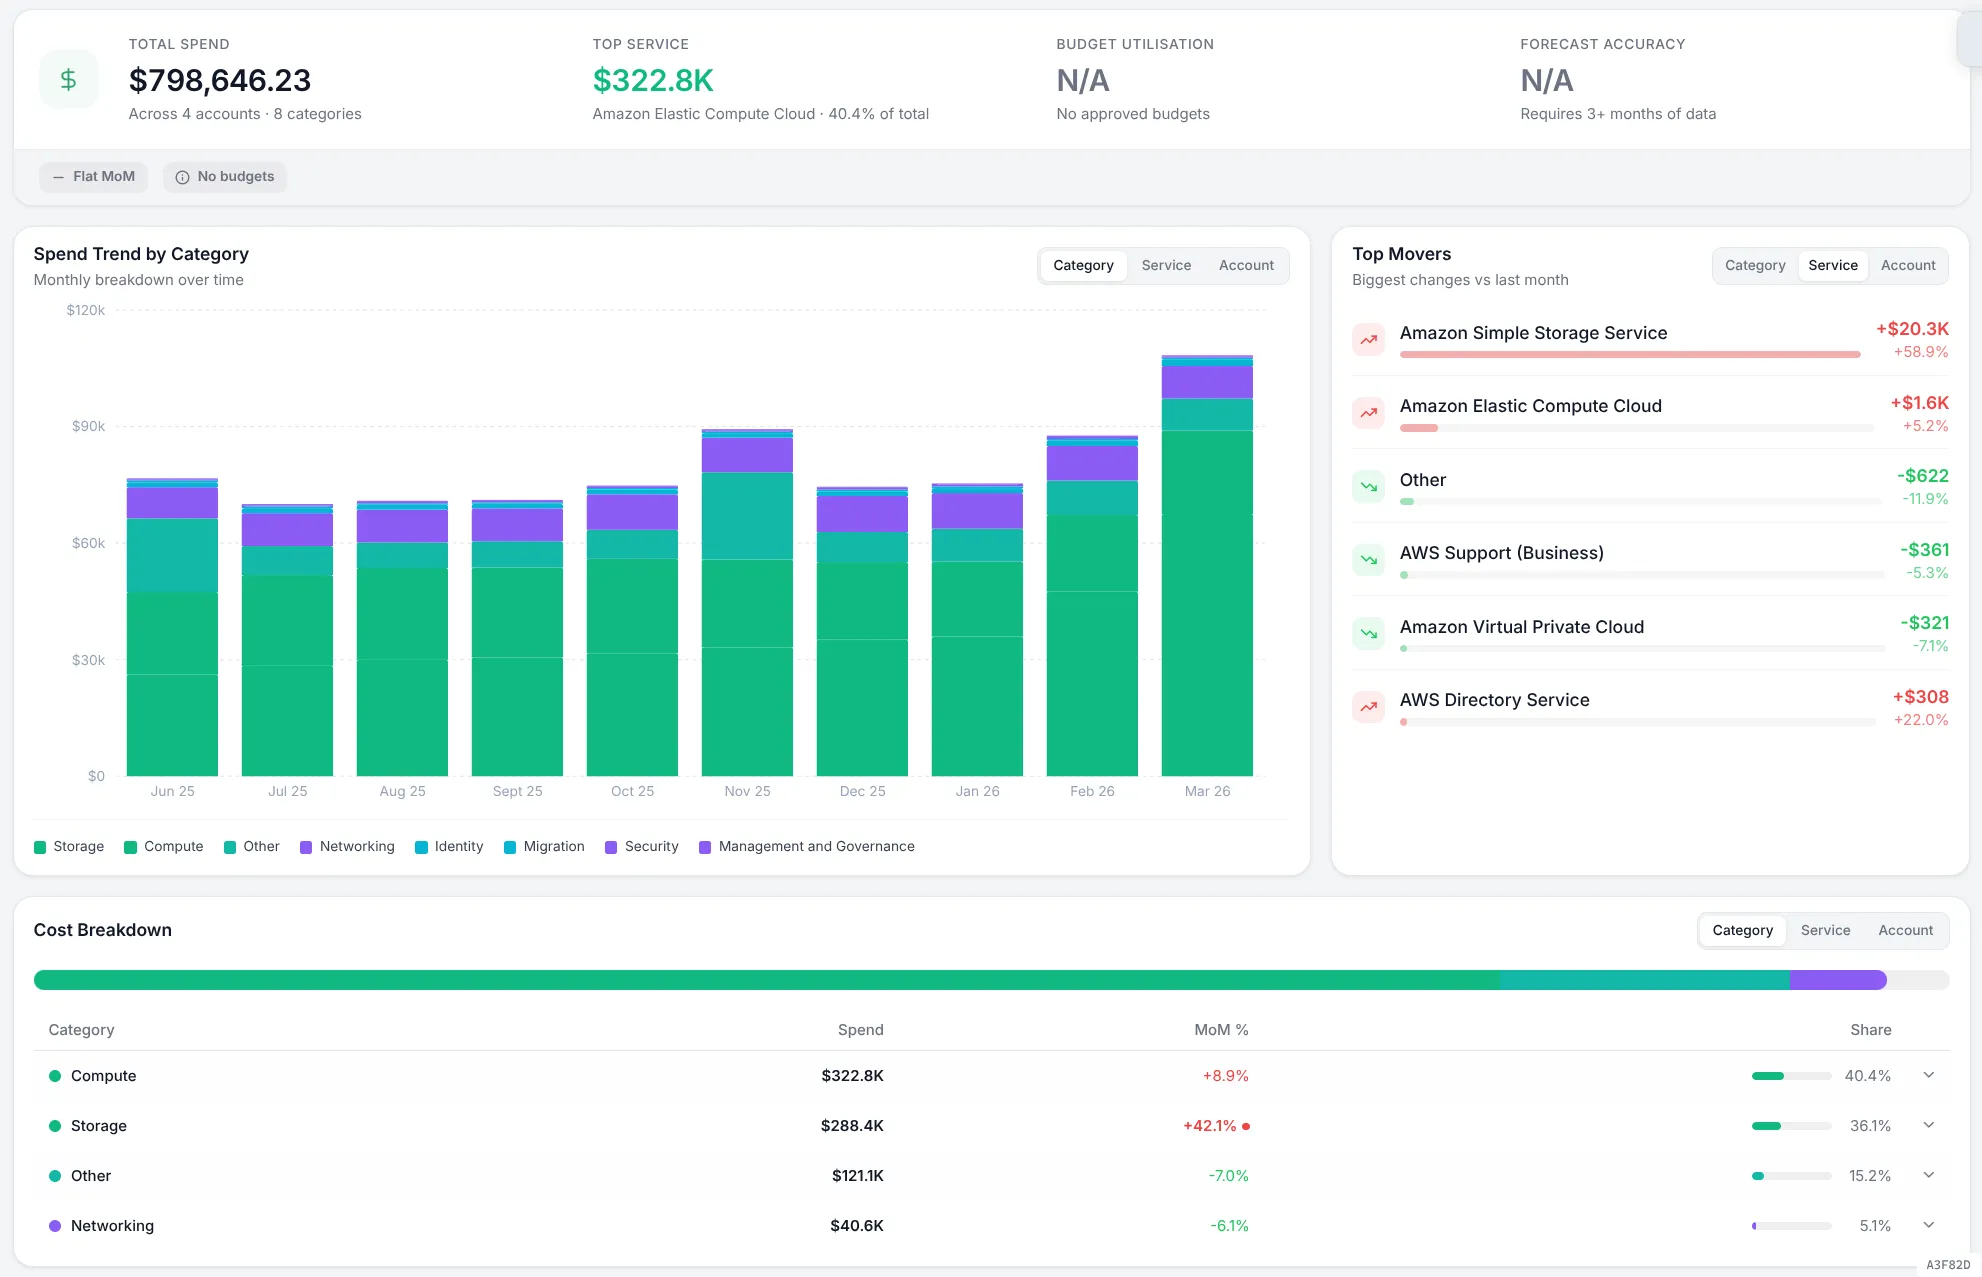
Spend Analysis.
Total spend, top service, budget utilisation, and forecast accuracy at the top. Trend by category, service or account underneath. Top movers vs last month, so the conversation starts with the biggest swings.
- 1
Total spend, top service, budget utilisation and forecast accuracy: the four numbers worth opening with.
- 2
Spend trend, multi-month, switchable between category, service and account.
- 3
Top movers: biggest increases and decreases vs last month, with $/mo deltas.
- 4
Budget breach line. The chart shows you the moment you crossed it.
- 5
Drill-down on any series: click into a service, account or tag without losing context.
What you see · 2 of 3
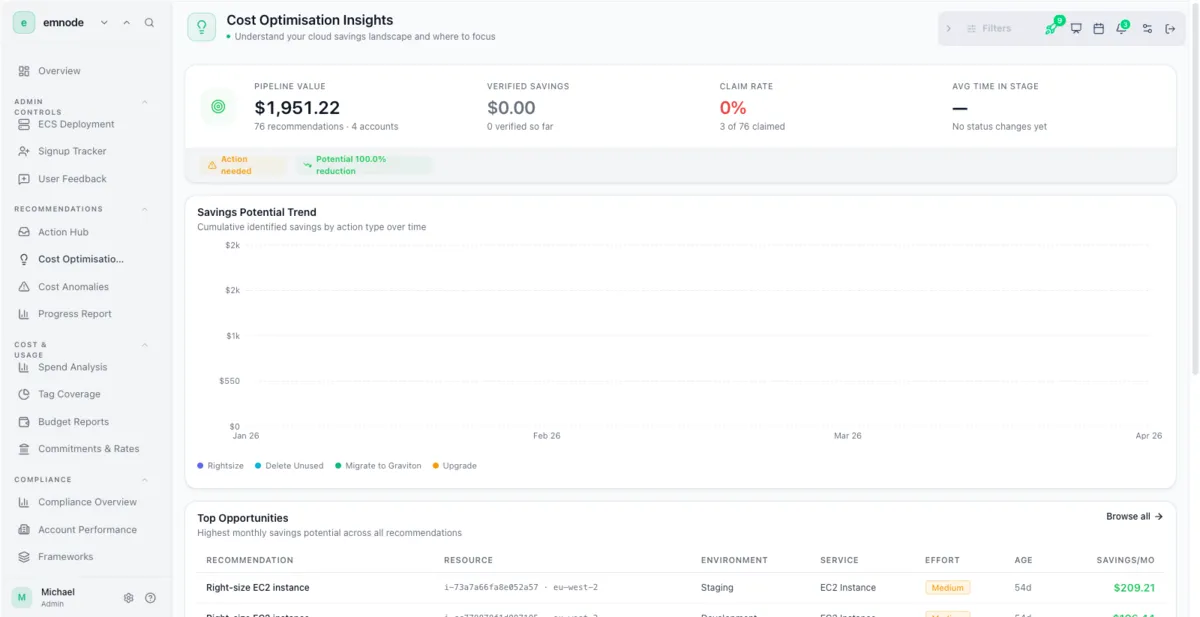
Cost Optimisations.
Pipeline value, verified savings, claim rate, and average time in stage at the top. Savings potential by action type underneath. Top opportunities table priced and ranked by effort.
- 1
Pipeline value vs verified savings: what is identified, what has actually landed.
- 2
Savings Potential Trend by action type: Rightsize, Delete Unused, Migrate to Graviton, Upgrade.
- 3
Top opportunities ranked by $/mo with effort and age, so easy wins are obvious.
- 4
Every recommendation flows directly into the Action Hub from here: claim and own in one click.
What you see · 3 of 3
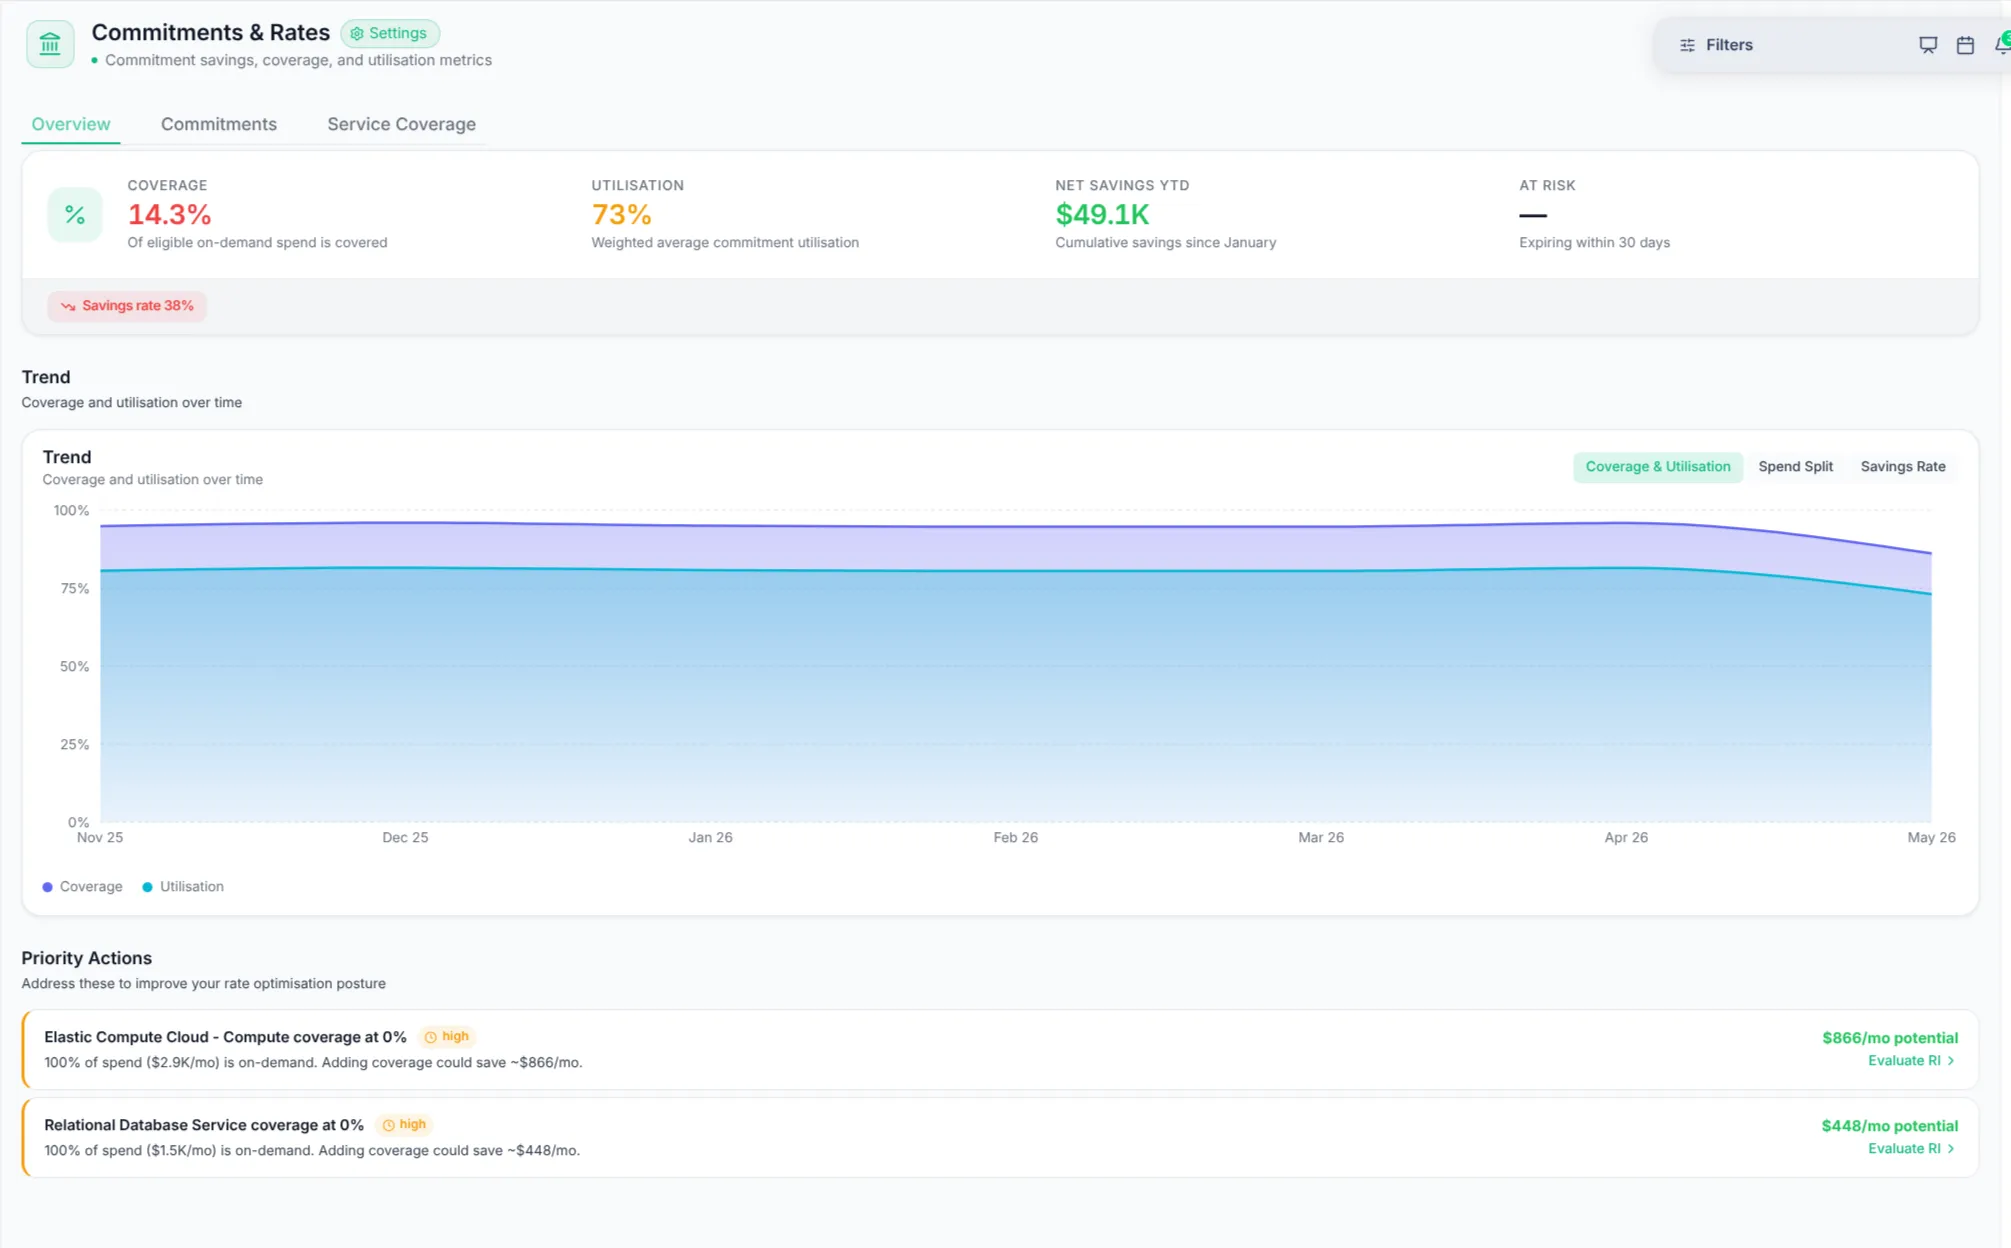
Commitments & Rates.
Coverage, utilisation, net savings YTD, and at-risk expiry up top. Coverage and utilisation trends underneath. Priority actions priced and ready for the next purchase decision.
- 1
Coverage and utilisation: the two numbers that decide whether you are over- or under-committed.
- 2
Net savings YTD vs on-demand baseline, proof that commitments paid off.
- 3
At-risk expiry: what runs out in the next 30, 60, 90 days.
- 4
Effective Savings Rate: the single KPI worth tracking month on month.
Role-based views
Same data. Three lenses.
Finance, engineering, and leadership each open Emnode for different reasons. The dashboards are designed for that, not one shared view that nobody finds useful.
Finance
Budgets and forecasts, spend vs actual with trends, variance commentary on the biggest movements.
Engineering
Efficiency metrics, optimisation opportunities ranked by $/mo, ownership of in-flight savings.
Leadership
Traffic lights with drill-down when needed. The summary first, the detail only when asked for.
What we don't do
Honest about boundaries.
Opinionated software is honest about what it won't do. Here's where the line sits.
No auto-changes
We don't auto-rightsize, auto-delete, or auto-buy commitments. Every change is a human decision.
No theoretical savings
We don't promise theoretical savings. We track verified ones, measured against your actual bill.
No tagging gauntlet
We don't ask you to pick a tagging strategy before you can see anything useful. Useful on day one.
Pairs well with
Action Hub
Where every cost finding gets owned, decided, and verified.
Progress Reporting
Pipeline view of every saving from identified to verified.
Monthly Reviews
A monthly deck that builds itself from the same data.
Free cost calculator
Estimate AWS and Azure costs yourself, in your browser, no signup.
Learn the playbook
Right-size your compute
Right-sizing, Graviton and idle instances: match spend to what you actually run.
Lock in your commitments
Savings Plans and Reserved Instances: stop paying on-demand for steady-state workloads.
Kill idle waste
Unattached volumes, idle endpoints and orphaned IPs: delete what nothing uses.
Cut your storage bill
gp2→gp3, lifecycle policies and snapshot hygiene: squeeze the storage line.
Learn the Azure playbook
Right-size your Azure compute
Right-size VMs, scale sets and databases, and move spiky workloads to burstable SKUs.
Lock in Azure commitments
Reservations, savings plans and Azure Hybrid Benefit: stop paying pay-as-you-go for steady-state.
Kill idle Azure waste
Unattached disks, idle gateways and orphaned public IPs: delete what nothing uses.
Cut your Azure storage bill
Blob lifecycle tiering, disk right-sizing and snapshot hygiene: squeeze the storage line.
Common questions
How does Emnode help reduce cloud costs?
Emnode reduces cloud costs by breaking spend down by service, account and tag, then ranking each savings opportunity (rightsizing, idle resources, Graviton migration and commitments) by pound-per-month and effort. Every opportunity is tracked from identified to verified against your real bill, so nothing quietly slips.
Does Emnode work with both AWS and Azure?
Yes, Emnode works across both AWS and Azure. It reads AWS Cost Explorer and Cost & Usage data alongside Azure Cost Management, then normalises both into one view so multi-cloud spend sits side by side instead of in two separate consoles.
Will Emnode change my infrastructure or buy commitments automatically?
No, Emnode never changes your infrastructure or buys commitments automatically. It is read-only by design: it won’t auto-rightsize, auto-delete, or auto-purchase Reserved Instances or Savings Plans. Emnode reads, recommends and tracks; every change stays a human decision.
How does Emnode track Reserved Instance and Savings Plan coverage?
Emnode tracks Reserved Instance and Savings Plan coverage by showing commitment coverage, utilisation, net savings year-to-date and your Effective Savings Rate in one place. It flags commitments expiring in the next 30, 60 and 90 days, so renewals stop being a quarterly panic.
How is this different from AWS Cost Explorer?
Cost Explorer shows you the bill; Emnode turns it into owned work. It ranks opportunities by saving, gives finance, engineering and leadership their own views, and tracks verified savings over time across AWS and Azure together, not just what you spent, but what got fixed.
Your cloud operations won't sort themselves out.
But they don't need a specialist either. Connect Emnode, get clarity across all four pillars, and start closing the gap.
AWS & Azure · 14-day free trial · No credit card required