Progress Reporting
Proof the work is happening, and what it's worth.
A pipeline view of every finding from identified to verified, with ownership, throughput, and stale-item alerts. Nothing quietly disappears.
Owners · Throughput · Verified savings
Sound familiar?
Recommendations come in faster than they get closed.
"Who owns this?" is the most common question in the channel.
Last quarter's claimed savings can't be linked to verified savings.
Items go quiet for weeks and nobody notices.
What you see
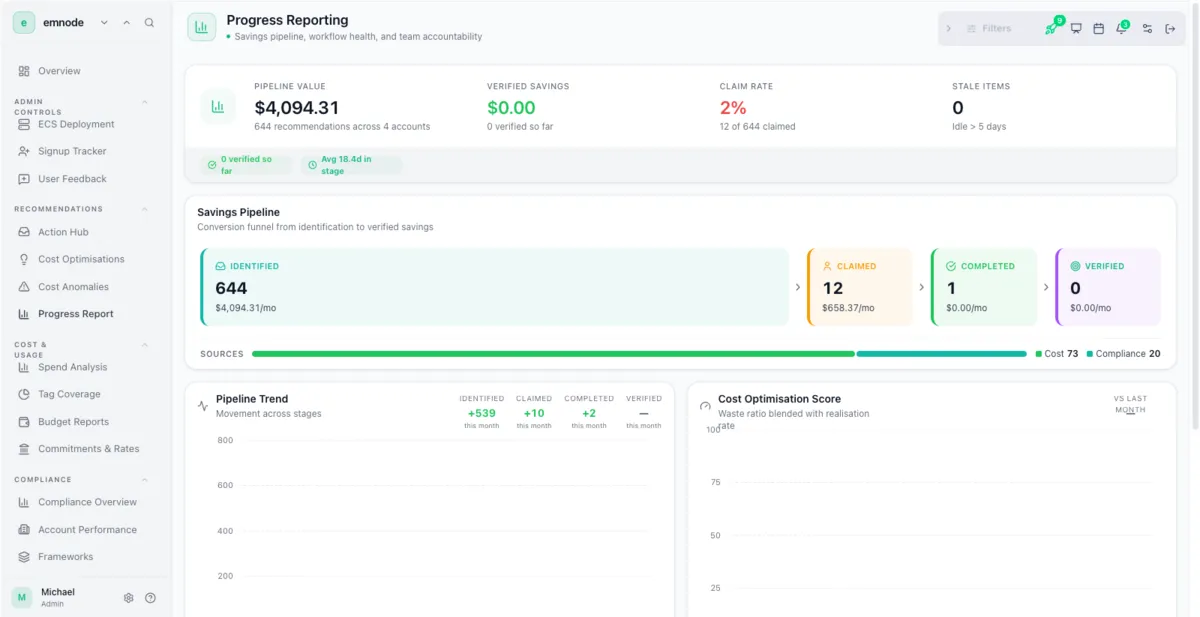
Pipeline value, verified savings, claim rate, stale items.
Four numbers at the top. The savings funnel underneath: Identified → Claimed → Completed → Verified, with $/mo at each stage. Then ownership, throughput, and the stalls.
- 1
Pipeline value: total $/mo across all open items, the headline for any progress conversation.
- 2
Verified savings: what has actually landed in the bill, calculated from spend.
- 3
Claim rate: percentage of items with an owner. Low claim rate means hidden backlog.
- 4
Stale items > 5 days idle. Resurfaces automatically, no Slack chasing.
The four sub-views
A pipeline, not a list.
Each sub-view answers a different stakeholder's question. Together they make 'where are we' a one-glance answer.
Savings pipeline funnel
Identified → Claimed → Completed → Verified, with $/mo at each stage and source breakdown.
Pipeline trend
Items moving across stages, month-on-month. The shape of the funnel tells you whether throughput is keeping up with intake.
Ownership
Who owns what, $/mo against each owner, claimed/done/verified counts. Includes an "Unowned" bucket so the gap is always visible.
Throughput
Average time in stage. Surfaces workflow stalls, usually one stage that quietly absorbs everything.
How accountability works
Without micromanagement.
The opinionated stance: accountability comes from the workflow, not from a manager chasing in Slack.
Open claiming
Anyone can claim. Items can be reassigned with a comment. Defers require a reason. The audit trail is automatic.
Auto-resurface
Stale items resurface in the queue automatically. The system does the chasing so the people don't have to.
Verified, not estimated
Verified savings are calculated from spend, not estimated up front. The number you report is the number that hit the bill.
Built for monthly reviews
Every metric here lands in the auto-generated deck.
The numbers on this page aren't just for the dashboard; they feed the monthly review presentation Emnode generates for you. So the FinOps meeting starts with the same picture you've been living with all month, not a deck someone built on Friday afternoon.
See how monthly reviews workCommon questions
What does Progress Reporting track?
Progress Reporting tracks every finding from Identified to Claimed to Completed to Verified, with pipeline value, verified savings, claim rate and stale-item alerts. Ownership and throughput views make “where are we?” a one-glance answer rather than a status meeting.
How are verified savings calculated?
Verified savings are calculated from your actual spend, not estimated up front. The number you report is the number that hit the bill, so last quarter’s claimed savings can always be tied back to what was genuinely realised.
How does Progress Reporting surface stalled work?
A throughput view shows average time in each stage, exposing the one stage that quietly absorbs everything. Items idle for more than five days resurface in the queue automatically; the system does the chasing, so people don’t have to.
How do I see who owns what?
The ownership view shows pound-per-month against each owner with claimed, done and verified counts, plus an explicit “Unowned” bucket so the gap is always visible. Accountability comes from the workflow, not from a manager chasing in Slack.
Does Progress Reporting connect to the monthly review?
Yes, every metric in Progress Reporting feeds the auto-generated monthly review deck. The FinOps meeting opens with the same picture you have lived with all month, not a deck someone rebuilt on Friday afternoon.
Your cloud operations won't sort themselves out.
But they don't need a specialist either. Connect Emnode, get clarity across all four pillars, and start closing the gap.
AWS & Azure · 14-day free trial · No credit card required